There are three main ways to create Calls in W&B Weave:

1. Automatic tracking of LLM library calls

Weave integrates automatically with many common integrations and frameworks, such as openai, anthropic, cohere, mistral, and LangChain.
Import the LLM or framework library, initialize your Weave project, and then Weave automatically traces all of Calls made to the LLM or platform to your project without any additional code changes. For a complete list of supported library integrations, see Integrations overview.
import weave

from openai import OpenAI
client = OpenAI()

# Initialize Weave Tracing
weave.init('intro-example')

response = client.chat.completions.create(
    model="gpt-4",
    messages=[
        {
            "role": "user",
            "content": "How are you?"
        }
    ],
    temperature=0.8,
    max_tokens=64,
    top_p=1,
)
If you want more control over automatic behavior, see Configure automatic LLM call tracking.

2. Tracking of custom functions

Often LLM applications have additional logic (such as pre/post processing, prompts, and more) that you want to track.
Weave allows you to manually track these Calls using the @weave.op decorator. For example:
import weave

# Initialize Weave Tracing
weave.init('intro-example')

# Decorate your function
@weave.op
def my_function(name: str):
    return f"Hello, {name}!"

# Call your function -- Weave will automatically track inputs and outputs
print(my_function("World"))
You can also track methods on classes.

Track class and object methods

You can also track class and object methods. You can track any method in a class by decorating the method with weave.op.
import weave

# Initialize Weave Tracing
weave.init("intro-example")

class MyClass:
    # Decorate your method
    @weave.op
    def my_method(self, name: str):
        return f"Hello, {name}!"

instance = MyClass()

# Call your method -- Weave will automatically track inputs and outputs
print(instance.my_method("World"))

Trace parallel (multi-threaded) function calls

By default, parallel Calls all show up in Weave as separate root Calls. To get correct nesting under the same parent Op, use a ThreadPoolExecutor.
The following code sample demonstrates the use of ThreadPoolExecutor. The first function, func, is a simple Op that takes x and returns x+1. The second function, outer, is another Op that accepts a list of inputs. Inside outer, the use of ThreadPoolExecutor and exc.map(func, inputs) means that each call to func still carries the same parent trace context.
import weave

@weave.op
def func(x):
    return x+1

@weave.op
def outer(inputs):
    with weave.ThreadPoolExecutor() as exc:
        exc.map(func, inputs)

# Update your Weave project name
client = weave.init('my-weave-project')
outer([1,2,3,4,5])
In the Weave UI, this produces a single parent Call with five nested child Calls, so that you get a fully hierarchical trace even though the increments run in parallel. The Trace UI, showing a single parent Call for outer, with five nested child Calls.

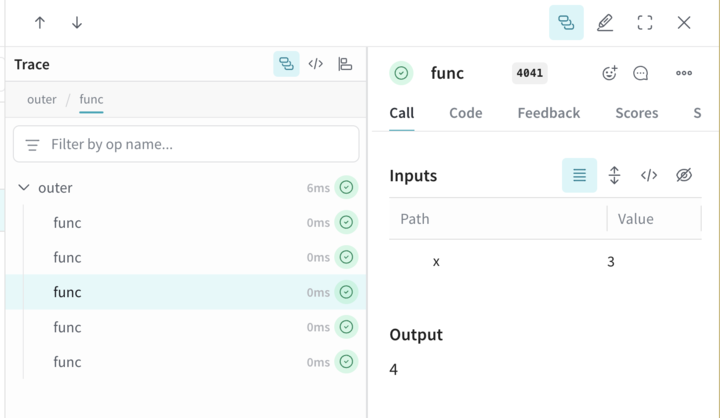
3. Manual Call tracking

You can also manually create Calls using the API directly.
import weave

# Initialize Weave Tracing
client = weave.init('intro-example')

def my_function(name: str):
    # Start a Call
    call = client.create_call(op="my_function", inputs={"name": name})

    # ... your function code ...

    # End a Call
    client.finish_call(call, output="Hello, World!")

    # Call your function
    print(my_function("World"))